Last spring, Vernier Software and Technology released the LabQuest2 – a device that collects data from a variety of sensors and has the ability to share this data wirelessly with any device that has a browser. To me, this is a game-changer in science education.
I decided to test it out this year while teaching phase changes.
In the past, I’ve had kids collect data while ice water is being heated over a bunsen burner, with the goal of identifying the melting and boiling point of water. Students often get lost in the data collection process, or tune out until after the data is collected (as if something magical will be revealed upon completion).
So I decided to do this as a demo, where students could use mobile devices (I have a classroom set of Motorola Xoom tablets) to access the data as it’s being collected. I also had my iPad mounted to the lab table with a Hoverbar. Using the camera app, I mirrored the video via the AppleTV hooked up to the projector so students could see what was happening.
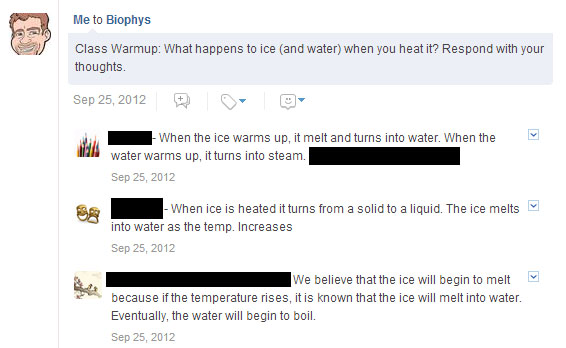
As there is significant downtime while waiting for the water to boil, I had them login to Edmodo and respond to a question after I lit the burner:
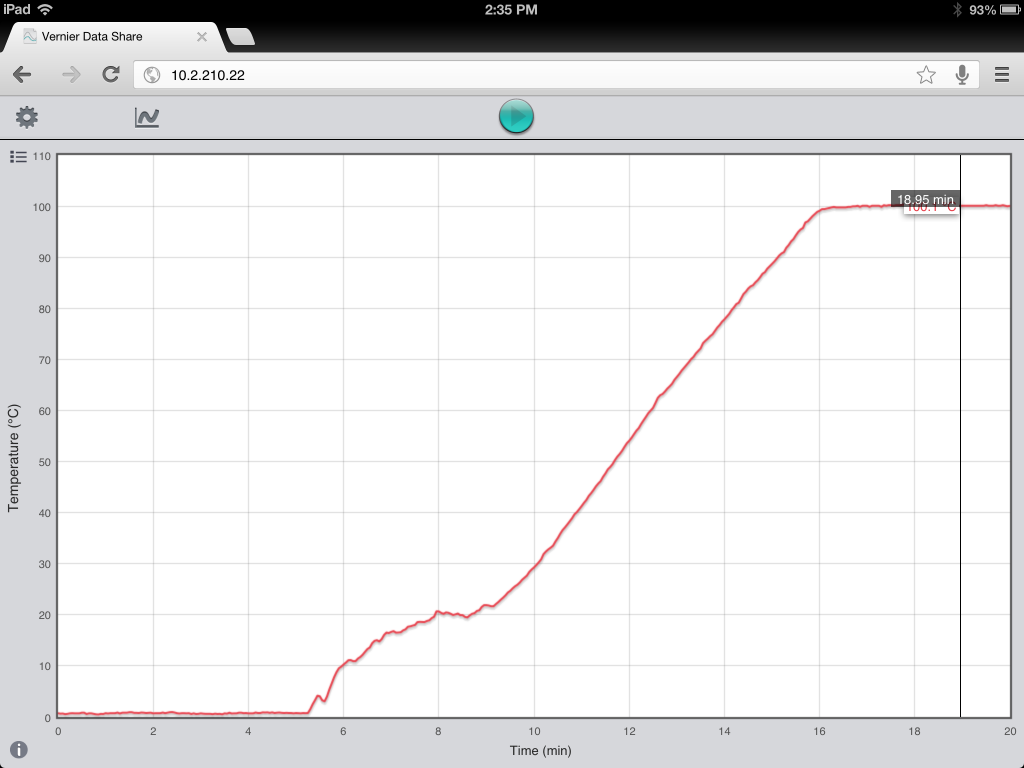
Students can touch and manipulate the data with the browser as it’s being collected. And they can determine the time and temperature by simply touching the graph (or any X and Y axis variable).
What I really liked about this approach is that I could guide students through the data collection process, and match it to their visual observations. For instance, I was able to ask “when did you first notice bubbles?,” and “at what temperature did that happen?”.
After the lesson, students responded to the Edmodo question again – now with the hindsight of what they actually observed, complete with data.


Recent Comments