Here is a compilation of demonstrations I do for “Combustion Day”, which capitulates three days of demonstrations to identify the five main types of chemical reactions. DO NOT TRY THESE AT HOME.
Combustion Day 2010 from Brian Bartel on Vimeo.
education, science, technology and life
You are currently browsing articles tagged Experiments.
Here is a compilation of demonstrations I do for “Combustion Day”, which capitulates three days of demonstrations to identify the five main types of chemical reactions. DO NOT TRY THESE AT HOME.
Combustion Day 2010 from Brian Bartel on Vimeo.
Tags: chemistry, combustion, Experiments, Science Education
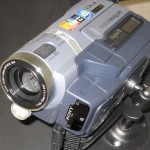
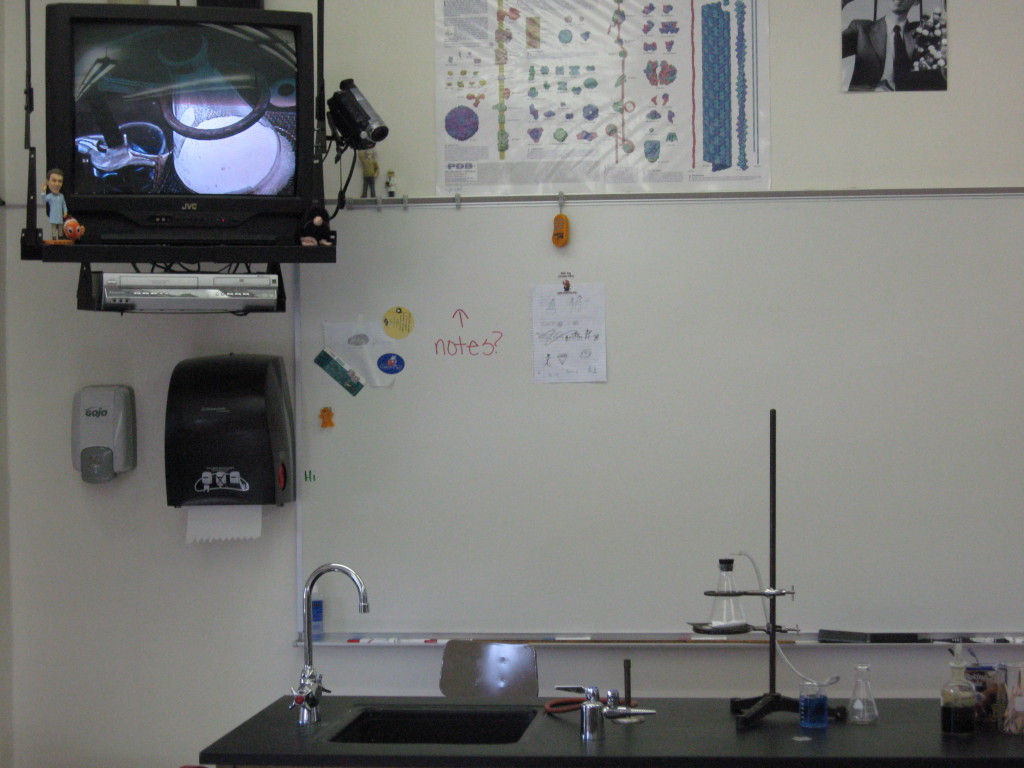
 After being frustrated with my students not being able to see all of my demonstrations, I decided to make a demo cam with some of my electronic junk.
The demo cam is simply an old Sony Handicam Digital 8 camcorder mounted on an inexpensive Videosecu Universal Camera Mounting Bracket.
The camera has an adapter that splits into an RCA video/mono audio cable, which I can easily plug into my classroom television. Switching the input on the TV is a piece of cake, and using the TV doesn’t interfere with the interactive whiteboard.
Here are some of the benefits:
1. I can project demos onto the television above, so the entire class can see every bit of the demonstration.
2. The zoom function is quite impressive; I can easily zoom in on discreet parts of the demonstration not easily seen – even by the person doing the demo. This is made even easier with the use of the remote control.
 3. Safety. The demo cam allows me to show demos without the need for the students to come anywhere near it; it also is far enough away from the demo so the camera is not damaged as well.
4. Because I have to use the record function to keep the image on screen, I can easily capture video of the demonstration. As there is a firewire output, I can easily capture the video with a connected laptop, and share it online (below see video demonstration of adding sodium to water).
Sodium in Water from Brian Bartel on Vimeo.
5. I can also capture slow reactions over a long period of time, import them to a computer and speed up the video to a shorter time (see video of copper in silver nitrate solution).
Some of the Drawbacks:
1. The angle is a little ackward because of the mounting limitations. It takes a little practice not to walk in front of it, and to make sure that the demo is in the viewing area while zooming.
2. In order to use the TV as a monitor, I have to use the record function. This requires me to stand on a stool, and manually rewind the tape every hour (it cannot be done with my remote).
Tags: demos, Experiments, Science Education, sony, Technology
Usually the during the week of homecoming, my Biophysical Science class is just finishing up a basic chemistry unit on the properties of matter. To keep the kids focused on science, I make sure to obtain a little dry ice to have my students observe a unique phase change known as sublimation.
We observe:
CO2 Expansion 2007 from Brian Bartel on Vimeo.
Note the rapid condensation that appears on the lab table once the pressure is equalized.
CO2 Expansion 2008 from Brian Bartel on Vimeo.
NOTE: this demonstration was done behind a Plexiglas screen when there were no kids in the room. Below is a picture of the bottle before, after, and a piece that was lodged in the ceiling (of which I am quite proud).
I should emphasize that this rapid buildup of gas pressure can be very dangerous. In fact, the rapid vaporization of liquid nitrogen in a sealed plastic container is exactly how I once blew up a sink (see About page). This is why a safe alternative to a live demo is to take an extreme video for future use.
Tags: demos, dry ice, Experiments, Videos
After a few days of unbearable heat in my classroom (no air conditioning in my school), I decided to quantify my misery.
Using a Vernier LabPro and Surface Temperature Sensor, I collected temperature readings in my classroom (in Fahrenheit) over the course of 8 hours of school. Here is the resulting graph:
You’ll notice two things:
Keeping these two things in mind, I have a suggestion to maintain ‘equity’ – keep rooms cooler in non-air conditioned buildings with lower class sizes!
Tags: Experiments, Misc
Recent Comments